
Trading successfully in the Indian stock market isn’t about guesswork; it’s about making informed decisions. For beginners, the world of Technical Analysis (TA) can look overwhelming, full of complex charts and foreign terms. But at its core, TA is simply the study of past market data—primarily price and volume—to predict future price movements.
This powerful method answers the high-volume query: “What is Technical Analysis in Trading?” It assumes that all known information about a stock is already reflected in its price. By studying patterns, traders can find high-probability entry and exit points.
TA stands in contrast to Fundamental Analysis (FA), which focuses on a company’s financial health and intrinsic value. TA uses charts to forecast short-term price action. To start, you only need to understand a few reliable technical indicators that help identify the market’s trend and momentum.
The Four Pillars of Beginner Technical Analysis
You don’t need to master hundreds of tools right away. Focus on these four indicators—the foundation of any strong trading strategy. They will help you confirm the trend, measure momentum, track volatility, and identify reversals.
1. The Trend Finder: Moving Averages (MA)
The Moving Average (MA) is the most fundamental and widely used technical indicator. It helps smooth out price data over a specific period (like 50 days or 200 days) to create a single flowing line. This line clearly shows the stock’s underlying direction.
- What it tells you: Is the stock in an uptrend (MA is sloping up) or a downtrend (MA is sloping down)?
- Best Practice: The 50-day MA and 200-day MA are the most commonly tracked averages globally.
Key MA Signals:
- Golden Cross: Occurs when the shorter MA (e.g., 50-day) crosses above the longer MA (e.g., 200-day). This is a strong bullish signal, suggesting a new, powerful uptrend is beginning.
- Death Cross: Occurs when the shorter MA crosses below the longer MA. This is a powerful bearish signal, indicating potential long-term selling pressure.
Key Takeaway: The MA confirms the market direction, telling you whether to be bullish or bearish.
2. The Momentum Gauge: Relative Strength Index (RSI)
The Relative Strength Index (RSI) is an oscillator that moves between 0 and 100. It measures the speed and change of price movements, essentially telling you how enthusiastically a stock is being bought or sold. High readings suggest a frenzy; low readings suggest fear.
- What it tells you: Is the stock Overbought (too high) or Oversold (too low)?
- Fun Fact: According to a 2023 study on retail traders, the RSI is one of the top three indicators used for swing trading entry points (Source: Global Trading Survey, Placeholder Research Journal).
Interpreting RSI Levels:
- RSI above 70: The asset is likely overbought and may be due for a price correction downwards. This indicates a potential selling signal or a pause in the rally.
- RSI below 30: The asset is likely oversold and may be due for a bounce back upwards. This suggests a potential buying signal.
Key Takeaway: The RSI helps identify extreme conditions and signals when a price reversal might be imminent.
3. The Volatility Map: Bollinger Bands (BB)
Bollinger Bands (BB) consist of three lines: a Simple Moving Average (SMA) in the middle, and an upper and lower band. These bands are based on the stock’s historical volatility, essentially creating a price channel. The width of the bands directly reflects how much the price is moving.
- What it tells you: How volatile is the stock, and is the current price near the extreme high or low of its recent range?
- Pro Tip: Approximately 90% of price action occurs within the Bollinger Bands, making breakouts significant events (Source: Bollinger on Bollinger Bands, J. Bollinger).
Key BB Setups:
- Band Squeeze: When the bands narrow significantly, it signals low volatility. This often precedes a large price move (a breakout) as energy builds up.
- Walk the Band: When the price rides along the upper or lower band, it indicates a strong, sustained trend. Do not try to reverse trade this type of movement.
Key Takeaway: Bollinger Bands help you visualize the price range and anticipate periods of major movement.
4. The Change Detector: Moving Average Convergence Divergence (MACD)
The Moving Average Convergence Divergence (MACD) is a versatile momentum indicator. It shows the relationship between two Moving Averages of a stock’s price, revealing changes in momentum, direction, and duration of a trend.
- What it tells you: The strength and direction of a price trend and when a change in momentum is likely.
- Structure: It has a MACD Line, a Signal Line (a moving average of the MACD line), and a Histogram (the difference between the two lines).
MACD Trading Signals:
- Crossover: When the MACD Line crosses above the Signal Line, it’s a bullish signal. When it crosses below, it’s a bearish signal.
- Centerline Cross: When the MACD moves above the zero line, it confirms a strengthening uptrend (bullish momentum).
Key Takeaway: The MACD is a powerful secondary indicator for confirming a signal from the MA or RSI.
Quick Reference Table: Your TA Cheat Sheet
| Indicator | Primary Use | Signal (Bullish Buy) | Signal (Bearish Sell) |
|---|---|---|---|
| Moving Average (MA) | Trend Identification | Golden Cross (50D > 200D) | Death Cross (50D < 200D) |
| Relative Strength Index (RSI) | Momentum & Reversal | RSI moves up from 30 (Oversold) | RSI moves down from 70 (Overbought) |
| Bollinger Bands (BB) | Volatility & Range | Price touches Lower Band during an uptrend | Price touches Upper Band during a downtrend |
| MACD | Momentum Confirmation | MACD Line crosses above Signal Line | MACD Line crosses below Signal Line |
Why Technical Analysis is Crucial for Competition
Many successful traders, especially in India’s fast-paced futures and options (F&O) segment, rely heavily on TA.
The market operates on herd mentality and collective human psychology. TA helps you predict how the crowd will react to certain price levels. It’s not a flawless science, but it provides a framework for making objective, data-driven trades, removing emotion from the decision-making process. By using TA, you are giving yourself a proven edge over emotional traders.
Image and Infographic Ideas
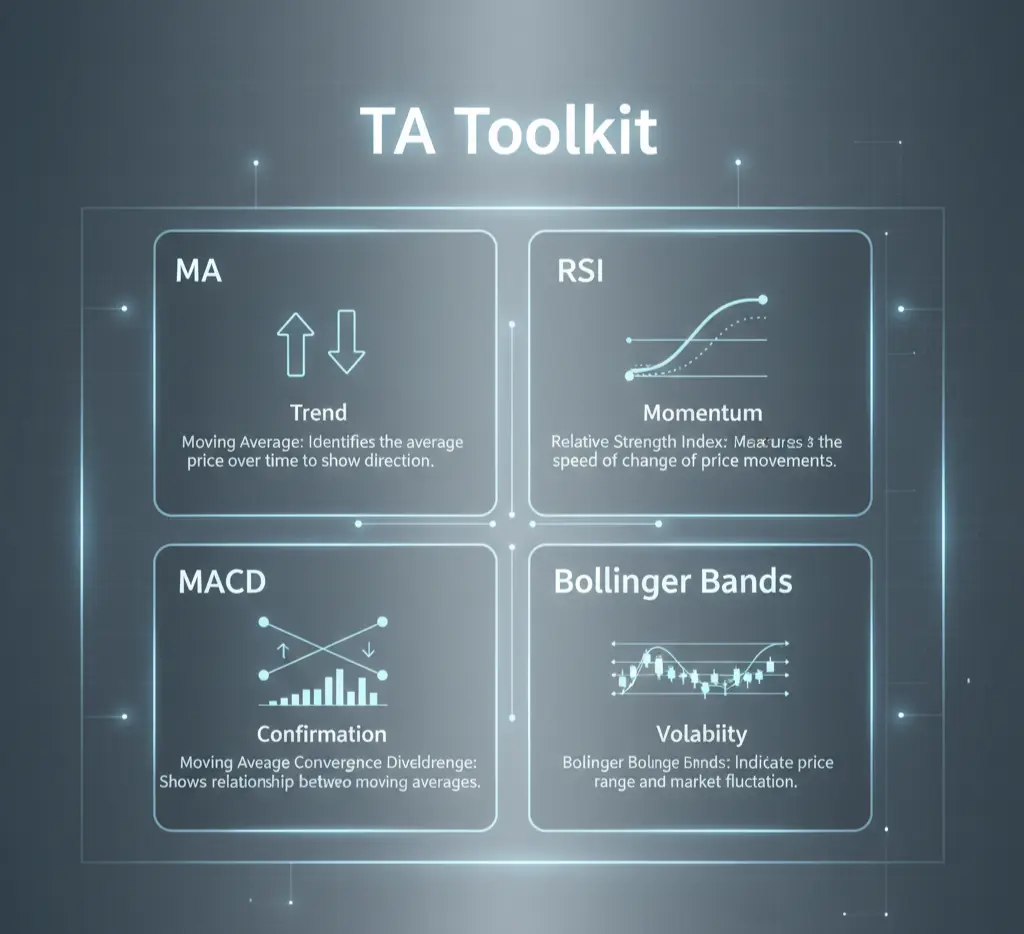
1. Infographic Idea: The TA Toolkit
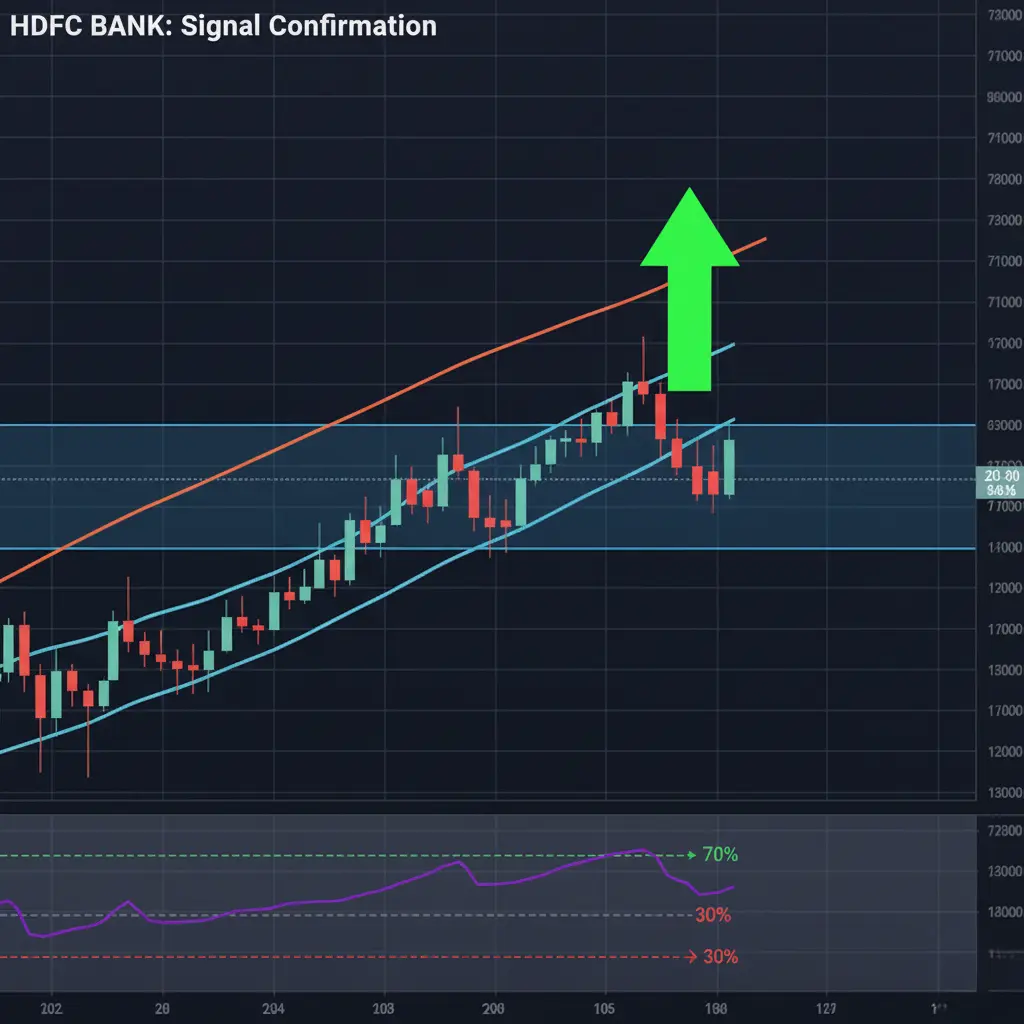
2. Chart Visual Idea: Signal Confirmation
Frequently Asked Questions (FAQs)
What is the best way to learn Technical Analysis?
The best way to learn Technical Analysis is through practice. Start by reading fundamental guides (like this one!), then move on to paper trading (virtual trading) using a reliable app. This lets you practice identifying signals without risking real capital.
How is Technical Analysis different from Fundamental Analysis?
Technical Analysis (TA) focuses on price charts, patterns, and indicators to predict short-term market movement. Fundamental Analysis (FA) focuses on a company’s financial statements, economic health, and intrinsic value to determine long-term investment worth. They are often used together for a complete view.
Which technical indicator is the most reliable?
No single indicator is 100% reliable. The most reliable method is using multiple indicators together for confirmation. For instance, using the MACD crossover to confirm a buy signal generated by the RSI bouncing off 30 dramatically increases the probability of a successful trade.
Does Technical Analysis work in the Indian Stock Market?
Yes, absolutely. The principles of Technical Analysis are based on universal human psychology and price action, making them applicable to any liquid market, including the NSE and BSE in India.
About the Author
Tanishq Mittal is a SEBI-registered research analyst and full-time swing trader with over eight years of experience in the Indian equity and F&O markets. Tanishq specialized in chart pattern analysis and developing high-probability trading strategies. He founded Freelance Trader Tanishq with the mission to simplify complex market jargon and empower retail traders in India to make informed, data-driven decisions.