

The Nifty 50 is a term you hear every day in the Indian financial news. It’s the most widely recognized measure of the country’s stock market performance. Understanding the Nifty 50 is the first, most crucial step for any aspiring investor or trader.
This guide will break down the index completely, from its simple meaning to its complex calculation. By the end, you’ll know exactly what the Nifty 50 is and how you can use it to grow your wealth.
I. Defining the Nifty 50 Index
What is a Stock Market Index?
Think of a stock market index as a report card for a specific part of the economy. It’s not a single company’s stock, but a basket of stocks.
This basket shows you how that group of companies is performing overall. If the index goes up, the companies in the basket are doing well on average.
Indices help investors quickly gauge market sentiment and broad economic health. They act as indispensable benchmarks for fund managers and analysts alike.
The Official Definition of the Nifty 50
The Nifty 50 is the benchmark index of the National Stock Exchange (NSE) of India. It represents the weighted average of 50 of the largest Indian companies.
These companies are selected across various sectors and are highly liquid, meaning they are easy to buy and sell. The index covers approximately 65% of the free-float market capitalization of all NSE-listed stocks [Source: NSE Indices Factsheet].
The Nifty 50 is constantly tracked and recalculated in real-time throughout the trading day.
Why is it called ‘Nifty 50’?
The name ‘Nifty’ is a clever portmanteau, or a blend, of two words: National and Fifty. It signifies the national scope of the index.
The ’50’ clearly indicates that the index tracks the performance of 50 select stocks. This simple naming convention helps in its universal recognition across the market.
It was launched on April 22, 1996, with a base date set in 1995.
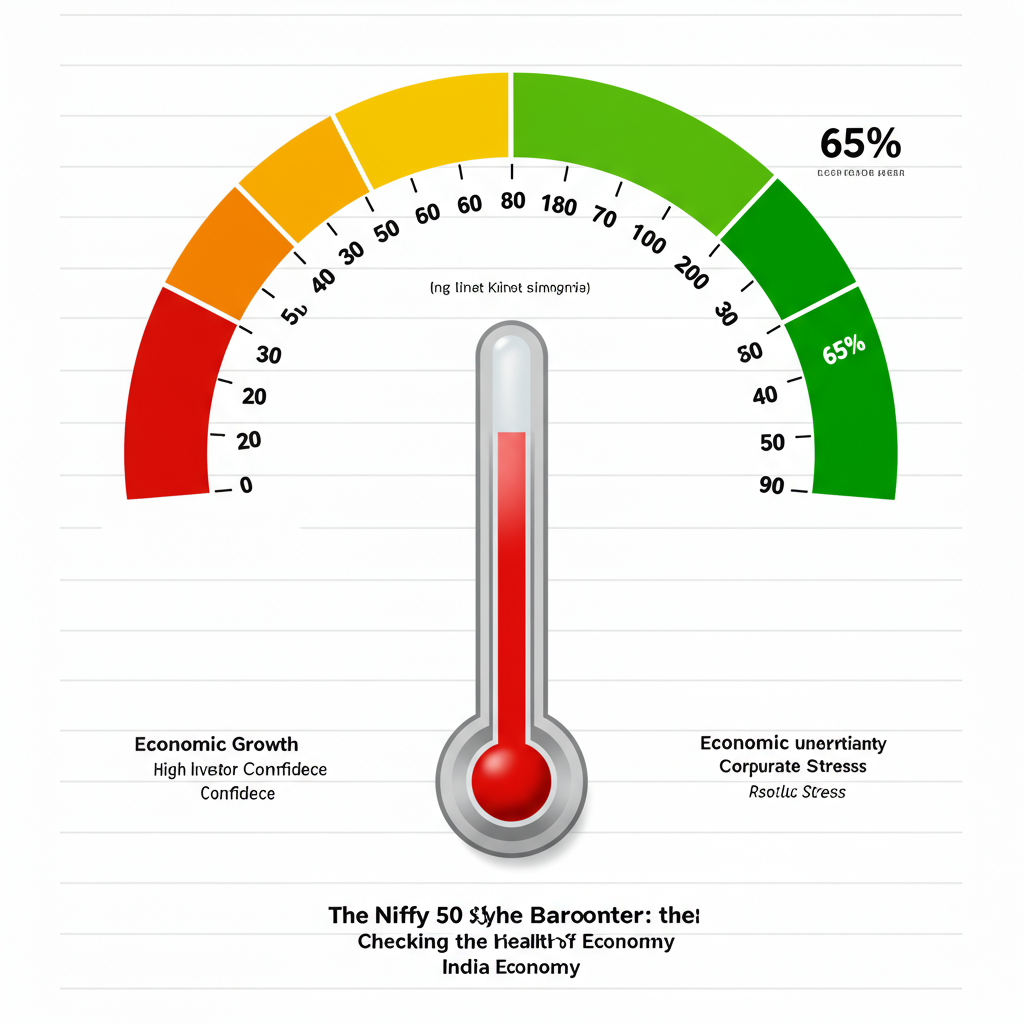
The Nifty 50’s Role as India’s Economic Barometer
The Nifty 50 is often called the barometer of the Indian economy. Since it includes the largest and most influential companies, its movement reflects the mood of the entire nation’s corporate sector.
A rising Nifty suggests business growth, strong corporate earnings, and high investor confidence. Conversely, a falling Nifty can signal economic stress or uncertainty.
It is a vital indicator used by policymakers, economists, and global fund houses.
II. The Components: Who is in the Nifty 50?
Selection Criteria: The Rules for Nifty Inclusion
To be included in the elite Nifty 50, a company must meet strict criteria set by NSE Indices Limited. These rules ensure the index remains relevant, accurate, and highly liquid.
The primary requirements include a listing history of at least six months and eligibility to trade in the Futures & Options (F&O) segment.
Crucially, the stock must have high liquidity, measured by its average impact cost.
Key Selection Factors:
- Liquidity: The stock must have low impact cost for high-value transactions, ensuring efficient price discovery.
- Free-Float Market Cap: Only the publicly available shares (not held by promoters or government) are considered.
- Domicile: The company must be legally incorporated and domiciled in India.
- Sector Representation: The company must be part of an eligible sector within the economy.
Top 10 Companies in the Nifty 50
The movement of the Nifty 50 is heavily influenced by its largest members. These companies carry the highest “weight” in the index due to their huge free-float market capitalization.
Below is a table showing the top constituents (Note: These weights change frequently and must be updated with live data before publishing).
| Rank | Company Name | Sector | Approx. Weightage |
|---|---|---|---|
| 1 | HDFC Bank Ltd. | Financial Services | [Insert Current %] |
| 2 | Reliance Industries Ltd. | Oil, Gas & Consumable Fuels | [Insert Current %] |
| 3 | ICICI Bank Ltd. | Financial Services | [Insert Current %] |
| 4 | Infosys Ltd. | Information Technology | [Insert Current %] |
| 5 | TATA Consultancy Services Ltd. | Information Technology | [Insert Current %] |
| 6 | State Bank of India | Financial Services | [Insert Current %] |
| 7 | Kotak Mahindra Bank Ltd. | Financial Services | [Insert Current %] |
| 8 | ITC Ltd. | Consumer Goods | [Insert Current %] |
| 9 | Axis Bank Ltd. | Financial Services | [Insert Current %] |
| 10 | Bajaj Finance Ltd. | Financial Services | [Insert Current %] |
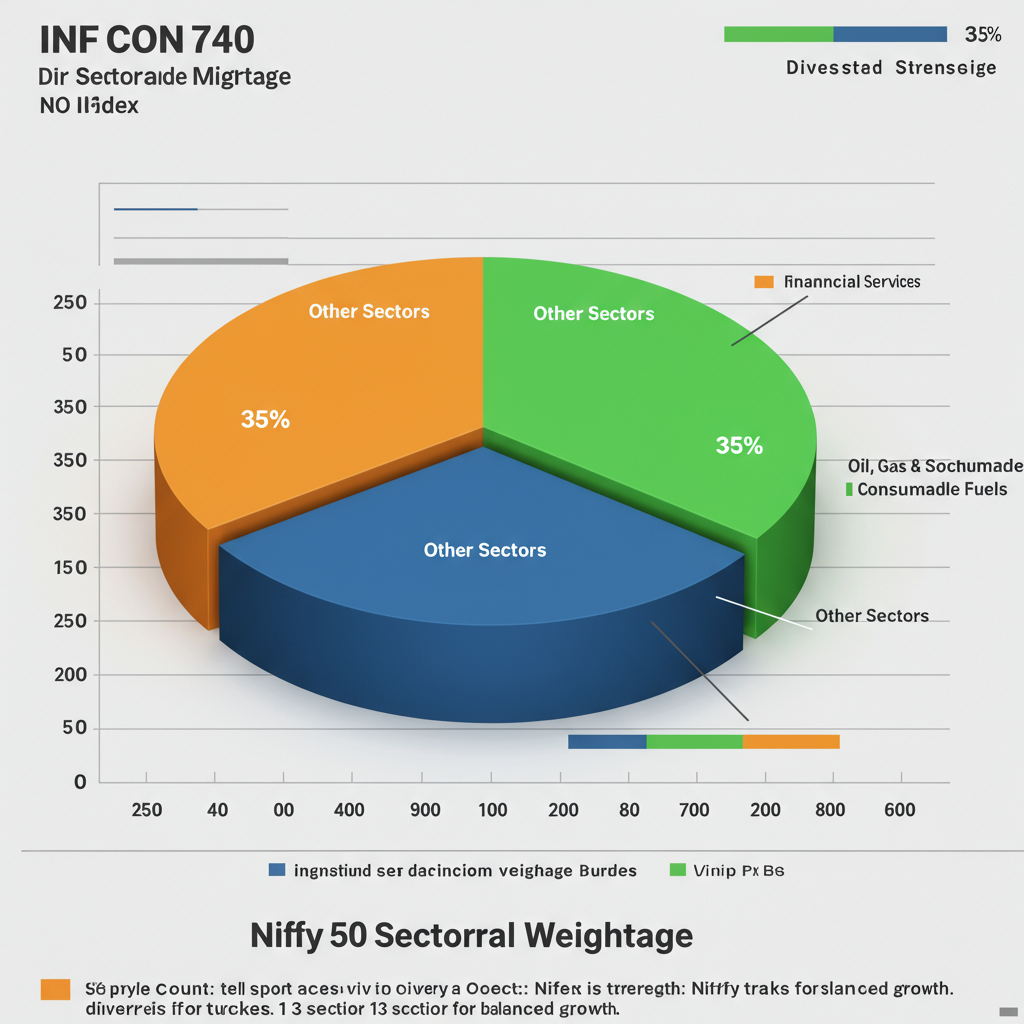
Sectoral Representation
The Nifty 50 provides exposure to the broad Indian economy by covering 13 diverse sectors. This diversification helps mitigate the risk associated with investing in a single industry.
The index’s composition is dominated by certain heavyweight sectors like Financial Services.
Understanding the weightage helps you identify which sectors primarily drive the index’s performance. For example, any major policy changes in the financial sector will strongly affect the Nifty.
The Semi-Annual Rebalancing Process
The list of 50 companies is not set in stone; it is reviewed and updated twice a year. This process is known as semi-annual rebalancing.
The cut-off dates for data consideration are usually January 31 and July 31.
Changes in the constituent list help ensure that the Nifty 50 always remains a true reflection of the largest and most liquid companies. Companies that no longer meet the criteria are removed, and new ones are added.
III. How is the Nifty 50 Index Calculated?
Understanding the Free-Float Market Capitalization Method
The Nifty 50 uses the Free-Float Market Capitalization method. This calculation is crucial for providing an accurate index value.
It calculates the total value of a company by only considering the shares available for public trading. Shares held by promoters, government, or long-term locked-in investors are excluded.
This method gives greater weight to companies where a larger proportion of shares are freely traded in the market.
Calculation Formula Breakdown
The index value is calculated using a ratio, which compares the current market value of all 50 stocks to their value on the base date.
This is the standard formula used for index computation:
$$ \text{Index Value} = \frac{\text{Current Market Value}}{\text{Base Market Capital}} \times 1000 $$
Here, the ‘Current Market Value’ is the aggregated free-float market cap of all 50 stocks. The Base Value of 1000 serves as the starting reference point.
The Concept of Base Date and Base Value
The calculation requires a starting point to measure all future movements. The Nifty 50’s history began with these two foundational figures:
- Base Date: November 3, 1995.
- Base Value: 1000.
All subsequent index movements are compared back to this base value. If the index is at 20,000, it means the index value has increased 20-fold since 1995.
What is the Investable Weight Factor (IWF)?
The Investable Weight Factor (IWF) is a critical concept in the free-float calculation. It’s a multiplier used to determine the exact proportion of shares available for public trading.
IWF ensures that only the freely tradable shares contribute to the market cap used in the index calculation.
This is a key detail that distinguishes the NSE’s methodology and makes the Nifty 50 a robust benchmark.
IV. Investment and Trading Opportunities in Nifty 50
Investing Directly vs. Indirectly
You cannot directly buy “the Nifty 50.” It is merely a number, or an index value. However, you can invest in the performance of the index through two main routes:
- Direct Investment: Buying the individual stocks that make up the Nifty 50 (e.g., buying HDFC Bank and RIL shares).
- Indirect Investment: Buying financial products that track the Nifty 50 (e.g., Index Mutual Funds or ETFs).
For most new investors, the indirect route is simpler and safer, offering instant diversification. (We’ll cover Index Funds and ETFs in a separate post soon!)
Trading Nifty 50 Futures and Options (F&O)
The Nifty 50 is one of the most popular instruments for derivatives trading in India. Futures and Options allow traders to speculate or hedge against the future movement of the index.
Key Derivative Products:
- Nifty Futures: Contracts to buy or sell the index at a predetermined price on a future date.
- Nifty Options: Contracts that give the buyer the right (but not the obligation) to buy or sell the index at a specific price.
Trading F&O is complex and carries high risk, requiring a deep understanding of strategy and volatility.
The Role of Nifty in Mutual Fund Benchmarking
Fund managers regularly compare the performance of their large-cap mutual funds against the Nifty 50. This is the ultimate test of their performance.
If a fund manager’s portfolio grows by 15% in a year but the Nifty 50 grew by 20%, the fund has actually underperformed.
The index acts as the gold standard for measuring market returns.
V. Major Milestones and Historical Performance
Key Historical Highs and Lows
Understanding the index’s history provides context for current market levels. The index has weathered many storms, from global recessions to domestic policy changes.
Here are some significant historical points (Please insert the current values before publishing):
| Event | Nifty 50 Value | Date |
|---|---|---|
| Base Value | 1,000 | November 3, 1995 |
| First Milestone | 5,000 | [Insert Year/Date] |
| Black Swan Event | Low of 2,500 (approx. during 2008 Crisis) | [Insert Actual Date] |
| All-Time High | [Insert Latest High Value] | [Insert Latest Date] |
How the Nifty 50 Reacted to Major Global Events
The index’s reaction to major events showcases its volatility and resilience.
- 2008 Global Financial Crisis: Nifty saw sharp declines as global banking markets froze, highlighting India’s connection to world markets.
- COVID-19 Pandemic (March 2020): The index crashed rapidly due to sudden economic shutdown, only to recover aggressively due to massive liquidity.
These events prove that while markets are volatile, the index has historically trended upwards over the long term.
VI. Frequently Asked Questions (FAQ Section)
Q: What is the difference between Nifty and NSE?
A: The NSE (National Stock Exchange) is the physical trading platform and organization where stocks are listed and traded. Nifty 50 is simply an index—a calculated number—that tracks the performance of 50 stocks listed on the NSE.
Q: What time does Nifty trading start?
A: The normal trading hours for the equity market and the Nifty 50 on the NSE are from 9:15 AM to 3:30 PM Indian Standard Time (IST), Monday to Friday.
Q: Can I lose money by investing in Nifty 50?
A: Yes, absolutely. While the index has grown over the long term, any investment carries market risk. When the stocks in the index drop in price, the value of your Index Funds or ETFs will also decrease.
About the Author
Tanishq Mittal is a SEBI-registered research analyst and full-time swing trader with over eight years of experience in the Indian equity and F&O markets. Tanishq specialized in chart pattern analysis and developing high-probability trading strategies. He founded Freelance Trader Tanishq with the mission to simplify complex market jargon and empower retail traders in India to make informed, data-driven decisions.